|
TOTAL EMITTANCE OF SOOT CLOUD
A total emittance can be found for a path S through an
isothermal cloud of suspended soot having a uniform concentration. The emittance
given now accounts only for the soot absorption coefficient because the
suspending gas is non-emitting. The effect of an emitting suspending gas is
included later. The total emittance is found from (9-12b) as
By using kλ/C
from (D-9) the ε(T,
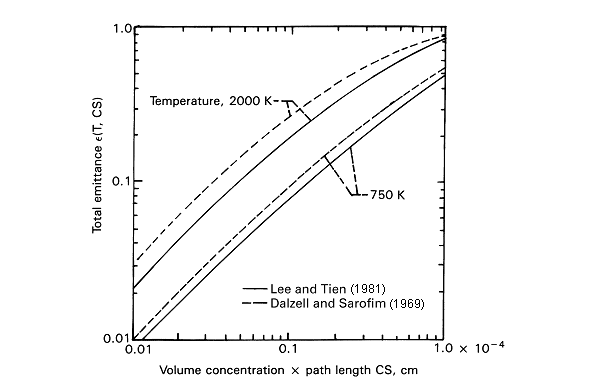
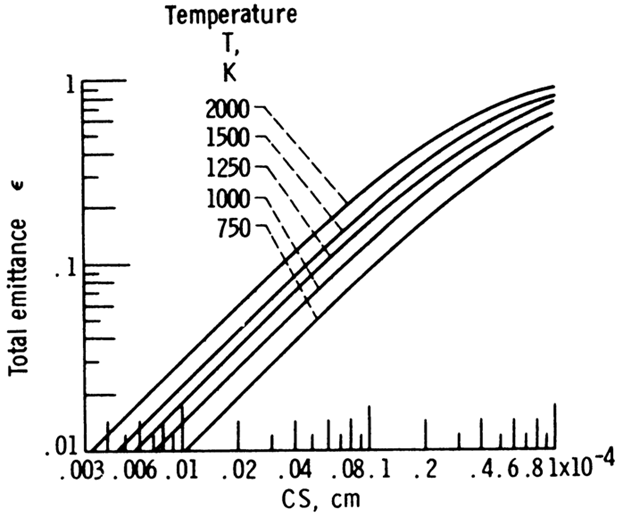
CS) can be evaluated numerically, and is in Fig. D-5 (dashed lines) for
propane soot, using properties in Table D-1. By integrating over a distribution
of particle sizes, it was found in Siddall and McGrath (1963) that individual
particle sizes were unimportant, and for a fixed T and S the
ε depends only on the
soot volume concentration. An electron oscillator model for soot optical
constants was developed in Lee and Tien (1981). The constants were used in the
Rayleigh equation for the absorption coefficient, and the integration in (D-12)
then carried out. The results for two temperatures are in Fig. D-5, and they are
somewhat below those in Fig. D-6.
TABLE D-2
Complex refractive indices (n = n –
ik) of propane soot corrected for surface layer void fraction
of 0.18 [Felske et al. (1984)]
With certain assumptions a convenient analytical expression
can be derived for the total emittance of a soot cloud in a nonemitting gas.
From (D-9), if n and k are weak functions of λ, then
kλ/C
= k/λ, where k/ is a constant depending on the type of
soot. This is an approximation, as the exponent α can deviate appreciably from
1. However, in some instances this was found to be a good approximation; for
example, for the soot data in Felske et al. (1984), Habib and Vervisch (1988),
Selamet (1992), and Liebert and Hibbard (1970), and in Fig. D-3 for λ up to
about 5 μm. The coefficient k was found as
kλ/C
at λ = 1 μm, and Fig. D-3 gave k (propane) ≈ 4.9 and k
(acetylene) ≈ 4. For soot from coal flames, k has been found as 3.7 to
7.5; for oil flames k ≈ 6.3 [Gray and Muller (1974)]. The value k =
5 was used for the calculations in Felske and Charalampoulos (1982).
The above approximation for kλ
is inserted into (D-12). Also, for the wavelength regions of interest here, the
Eλb can be approximated quite well by Wien’s formula,
where, to be consistent in the approximation, Wien’s formula
is also used in the denominator. For the integral
With k = 4.9 for propane soot, a comparison
with values from the numerical integration in Dalzell and Sarofim (1969) is in
Table D-3 and further results are in Fig. D-6. A comparison with the results of
Lee and Tien (1981) is in Fig. D-5. From Table D-3, Eq. (D-13) is shown to be a
useful approximation. The k/C2 = 4.9/(0.01439 m · K) = 341 m−1
· K−1 for this soot. Sarofim and Hottel (1978) recommend k/C2
= 350 m−1 · K−1 as a mean value for all types of
soot, and this coefficient does not vary significantly over the temperature
range of interest in combustion chambers.
FIGURE D-5 Total emittance
of soot particles in the Rayleigh limit [Lee and Tien (1981)].
A somewhat more complicated expression results from not using
the Wien formula in (D-12). Letting kλ
= Ck/λ and using (1-13) gives
If z = 1 + kCST/C2 and t
= C2/λT, this becomes
The integral is the pentagamma function
Results are in Table D-3 (using k = 4.9); they are not
better than those from (D-13). Yuen and Tien (1977) show that (D-14) can be
approximated by
TABLE D-3
Comparison of approximate suspension emittance for propane
soot with values from Dalzell and Sarofim (1969)
Stull and Plass (1960) give results for the scattering
coefficient of soot that show, in agreement with the Mie theory, that scattering
usually has little effect on emittance in the wavelength range that contains
significant energy at hydrocarbon combustion temperatures. Erickson et al.
(1964) experimentally studied scattering from a luminous benzene-air flame.
Their results agree with the predictions of Stull and Plass if the soot
particles are taken to be of two predominant diameters. This indicates that
particles approximately 250 Å in diameter are formed along with agglomerated
particles with an equivalent diameter of 1850 Å. These sizes were observed by
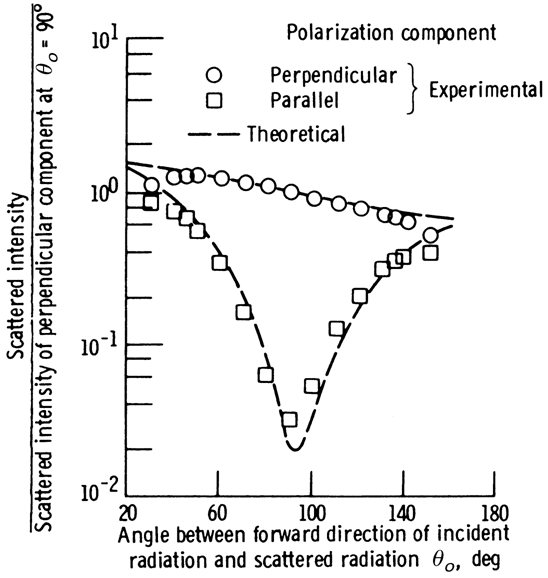
gathering soot with a probe and using electron microscopy. A comparison of some
of the experimental results of Erickson et al. with the analysis of Stull and
Plass (1960) is in Fig. D-7. Similar figures are in Köylü and Faeth (1993) for
soot aggregates in straight chains and fractal shapes. Fractal descriptions
provide a useful indication of the morphology of agglomerated soot particles
[Manickavasagam and Mengüc (1997), Charalampoulos (1992), Charalampoulos and
Chang (1991), Farias et al. (1995a)]. The agglomerated particles obey the
relation
where N is the number of spheres of diameter Dp
comprising the aggregate, Rg is the radius of gyration of the
aggregate, kf is a constant to be determined, and Df
is the fractal dimension. Most studies predict values of about Df
= 1.75 and kf = 8.0 [Farias et al. (1995a),
Manickavasagam et al. (1997)]. Observations of the radius of gyration provide
predictions of the number of particles in an agglomerate by using Eq. (D-15).
FIGURE D-7
Comparison of experiment with Mie scattering theory for
radiation scattered from benzene-air flame at l = 5461 Å. Theoretical curves
based on spheres of diameter 250 A with 0.002% spheres of diameter 1850 Å, all
with complex refractive index n - ik = 1.79 – 0.79i [Erickson et
al. (1964)].
The effects of soot shape on radiative energy transfer
predictions were examined in Farias et al. (1998) by using a realistic
simulation of the soot aggregation process. It was found that the effects of
soot morphology on spectral and total emissivities were less than 25% and 13%
respectively for typical soot volume fractions and flame temperatures. The
results suggest that soot shape effects can be neglected in the emission
predictions of soot-laden flames, thereby simplifying the engineering modeling
of radiation in combustion devices.
Thring, Beer, and Foster (1966) put some results of Stull and
Plass (1960), along with their own extensive experimental results, into useful
graphs of emittance, extinction coefficient, and soot concentration for flames
applicable in industrial practice. They note, however, that soot concentration
can only be predicted for flames geometrically similar and with the same control
variables as those that have already been studied. Their paper contains a useful
review of the worldwide effort to gather information on, and give methods for,
the prediction of radiation from luminous industrial flames. Other such
information is in Viskanta and Menguc (1987), Sarofim and Hottel (1978), Farias
et al. (1998), Thring et al. (1963, 1966), Sato and Matsumoto (1963), Yagi and
Inoue(1962), Bone and Townsend (1927), Leckner (1970), and
Viskanta (2005).
In addition to the uncertainties in optical properties and
hence in aλ and ε for soot, it is noted that
kλ
and ε are given in
terms of the soot concentration. To use Eq. (D-3), the Ck is needed. To
use Fig. D-6 to determine ε
for given flame size, the C in the abscissa must be
known. The C cannot be accurately computed from first principles, knowing
the fuel and burner geometry. Hence some indication of C or Ck
must be obtained by examining flames experimentally. It may be possible to
extrapolate performance for a particular application by examining a similar
flame. Examples of mathematical models to predict soot formation are in Coelho
and Carvalho (1995), De Champlain et al. (1997), Rizk and Mongia (1991), and
Magnussen and Hjertager (1977). For gas turbine combustors, because of the
complexity in estimating the luminous emissivity, a luminosity factor has been
introduced into the expression for the emittance of a nonluminous flame [Rizk
and Mongia]. |
|||||||||||||||||||||||||||||||||||||||||||||||||||||||||||||||||||||||


