|
ELECTROMAGNETIC-THEORY PREDICTION OF SOOT SPECTRAL
ABSORPTION
To examine more fundamentally the absorption coefficient of a
soot cloud in a nonabsorbing gas, electromagnetic theory is used [Charalampoulos
and Felske (1987), Lee and Tien (1981), Dalzell and Sarofim (1969), Siddall and
McGrath (1963), Stull and Plass (1960), Hawksley (1952), Felske and Tien (1973,
1977), Buckius and Tien (1977)]. By analogy to Eq. (1-46b), for particles all of
the same size, the absorption coefficient is
where N is the number of particles per unit volume and
Ap is the particle projected area (= πD2/4,
as particles are assumed spherical). The Qλ is the
spectral absorption efficiency factor, which is the ratio of the spectral
absorption cross section to the physical cross section of the particle (ratio of
energy absorbed to that incident on the particle). For small πD/λ, the
Mie equations give Qλ for a small absorbing sphere as
where n and k are functions of λ.
Then, from (D-7),
where C = NπD3/6 is
the volume of particles per unit volume of cloud. The
kλ/C
can be evaluated if the n and k of soot are known as
functions of λ.
In Dalzell and Sarofim (1969) the n and k
of acetylene and propane soot were measured by collecting soot and
compressing it on a brass plate. The n and k are
deduced from theory for reflection from an interface in conjunction with
measurements of the reflected intensity of polarized light; values are in Table
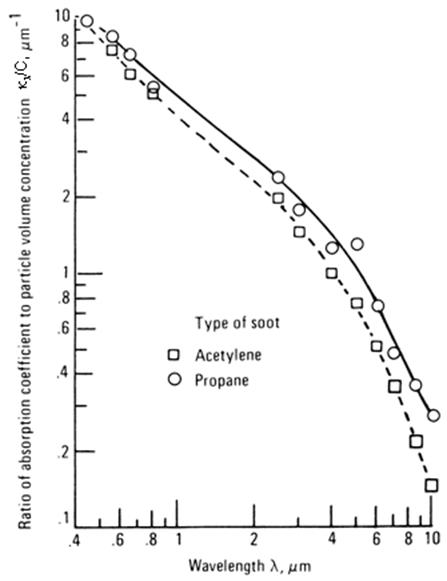
D-1. Using these values, kλ/C
was evaluated from (D-9), yielding the points in Fig. D-3. Although
kλ/C
decreases with λ, as expected from (D-3), an approximate curve fit by straight
lines on the logarithmic plot yields exponents on λ somewhat different
from those of (D-4) and (D-5). Similar results for the spectral absorption
coefficient are in Sivathanu et al. (1993); they also have a weak dependence on
temperature, in agreement with findings by Previous Page investigators.
The form of the exponent α(λ) predicted by Mie theory is
examined in the infrared region by equating (D-5) and (D-9),
By evaluating this relation at λ = 1, the constant
k1 for the infrared region is k1 = 36πF(1).
Then
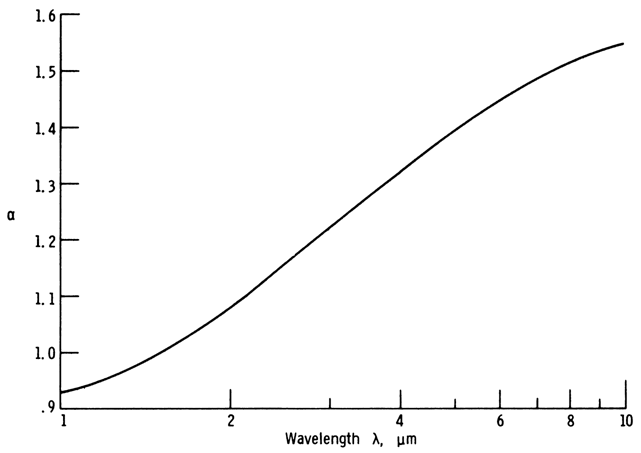
The optical properties of soot are used in F(1) and
F(λ) to evaluate α(λ). This was done in Siddall and McGrath (1963) using the
properties of a baked electrode carbon at 2250 K. The results are in Fig. D-4.
The trend is the same as in the experimental curves of Fig. D-1, but α(λ) values
are larger than the experimental values. They are also larger than the average
value of 0.95 recommended in (D-4). The discrepancy is probably partly due to
the optical properties of the baked electrode carbon being different from those
of soot. This is further discussed in Kunitomo and Sato (1970), where optical
properties of carbonaceous materials more like real soot are given, and good
comparisons of predictions with experiment are obtained in some instances.
FIGURE D-3 Ratio of spectral
absorption coefficient to particle volume concentration for soot particles.
FIGURE D-4 Calculated variation
of the exponent a with wavelength, using properties of baked electrode carbon at
2250 K [Siddall and McGrath (1963)].
TABLE D-2 Optical constants
of acetylene and propane soots [Dalzell and Sarofim (1969)]
In Felske et al. (1984) the compressed powder technique was
used to obtain n and κ for propane soot in the infrared region.
When soot is compressed, the layer adjacent to the surface has a finite void
fraction that may influence the reflection characteristics. In Felske et al.,
the soot was compressed with a pressure of 2000 atm and the surface reflections
conformed to the Fresnel equations. Electron micrographs were used examine the
surface void fraction and a correction for it was made to give the results in
Table D-2. The n values do not vary as much with λ as those in Table D-1,
and the κ values are smaller. The compressed soot technique
yields a specular reflection for infrared radiation, but in the visible region
the surface may not be optically smooth. For the visible region an in situ laser
light-scattering technique is described in Charalampoulos and Felske (1987).
Using this method for a methane-oxygen flame, the
|
|||||||||||||||||||||||||||||||||||||||||||||||||||||||||||||||||||||||||||||||||||||||||||||||||||||||||

